University of Konstanz develops visualization tool for illustration of critical care bed capacities all over Germany
The “Coronavis” tool developed at the University of Konstanz is easy to use and shows the data in a map of Germany. “Something like this has not existed until now”, says Professor Daniel Keim. “Coronavis gives doctors the possibility to enquiry about the exact capacities of critical care beds in Germany. This means that patients could be transferred to nearby or more distant hospitals – depending on the acute case of need”. The pre-requisite for doing so would be unlimited access to the data in the DIVI intensive care register.
System alerts of imminent overload
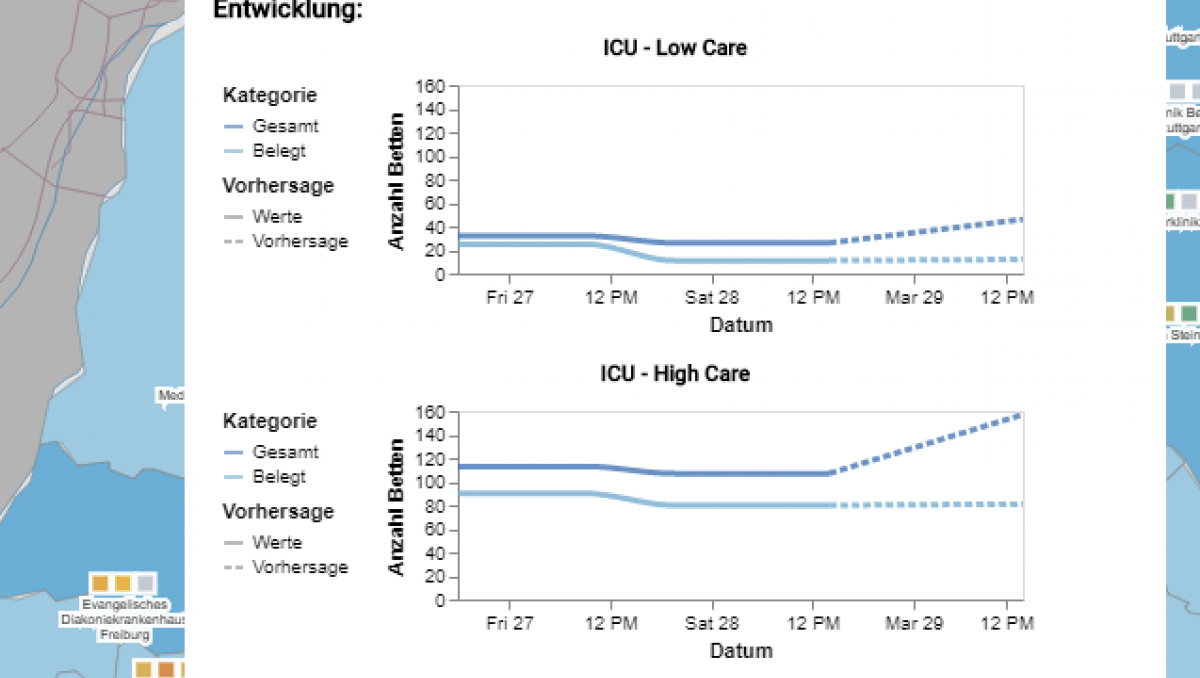
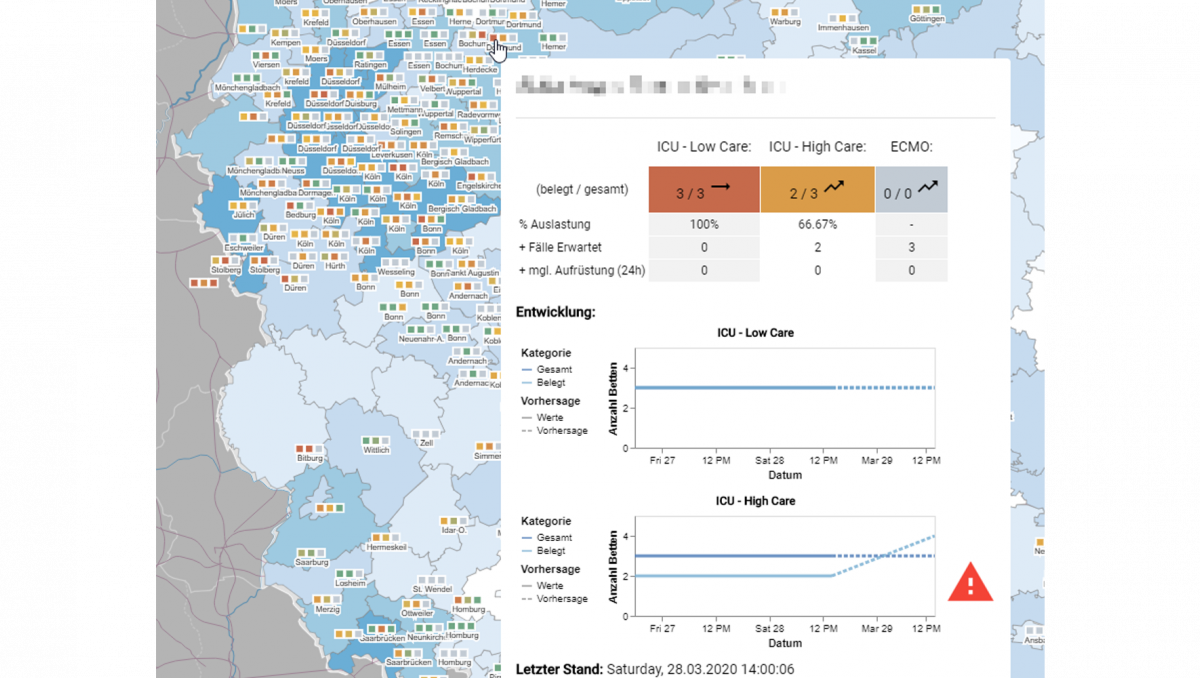
In addition to that, expected changes in available beds are displayed. The researchers integrated an alarm into the tool that can be triggered in case of shortages. “Especially in this regard we think an exchange with other experts would be really important to define at which point the system should trigger an alarm”.
Unique combination of different data in one system
The “Coronavis” tool also makes it possible to link hospital capacities to regional Covid-19 case numbers and cases of death. The tool shows how the case numbers change over time, too. Combining these different data makes it possible to anticipate shortages in hospitals early on and take corresponding countermeasures in time (e.g. transferring patients or increasing the number of ventilators).
When there are shortages in hospitals, a centrally organized distribution of Covid-19 patients to hospitals with available beds could take place, as recently demanded by German intensive care physicians. The main goal is to avoid a situation like in Northern Italy, where the hospitals are overloaded.

“In close coordination with Professor Kabitz from Konstanz hospital, we developed the visualization tool. We are very happy to contribute our expertise in the field of data analysis and visualization in the current corona crisis. In a next step, we would like to introduce our programme to epidemiologists to discuss further adaptations. The top priority now should be to provide an integrated analysis tool for Germany as quickly as possible. My team and I are interested in any kind of collaboration that can help us reach this goal”
Professor Keim, professor of data analysis and visualization at the University of Konstanz
Integrated additional information as important decision-making tool
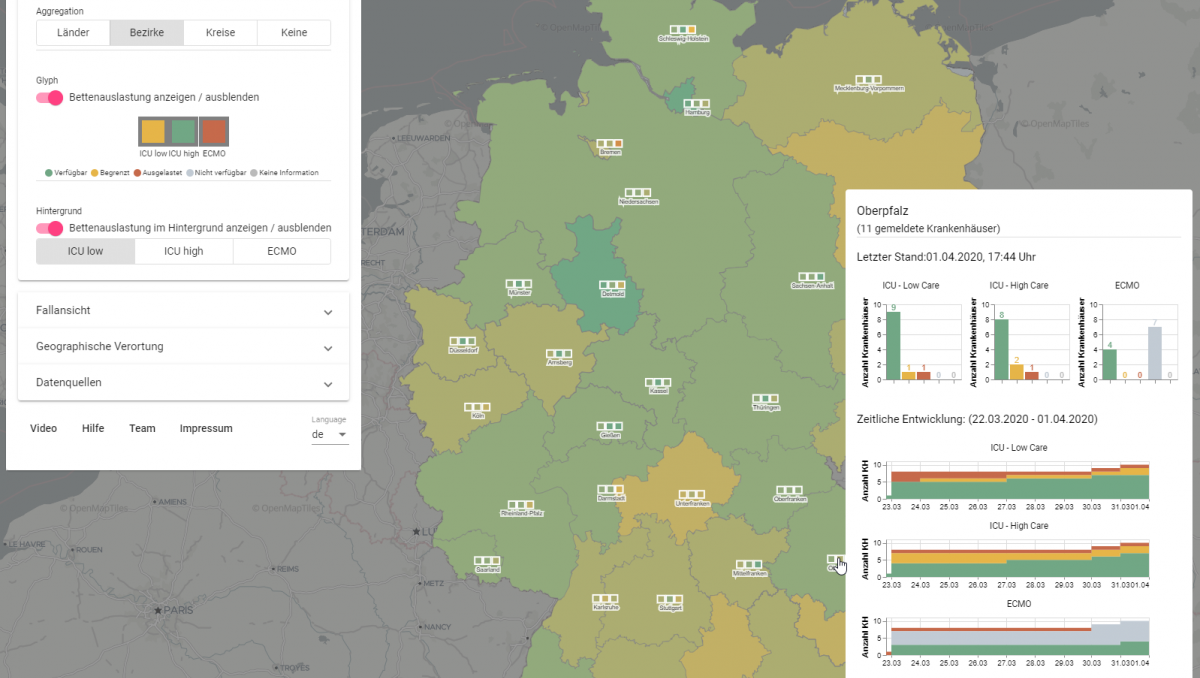
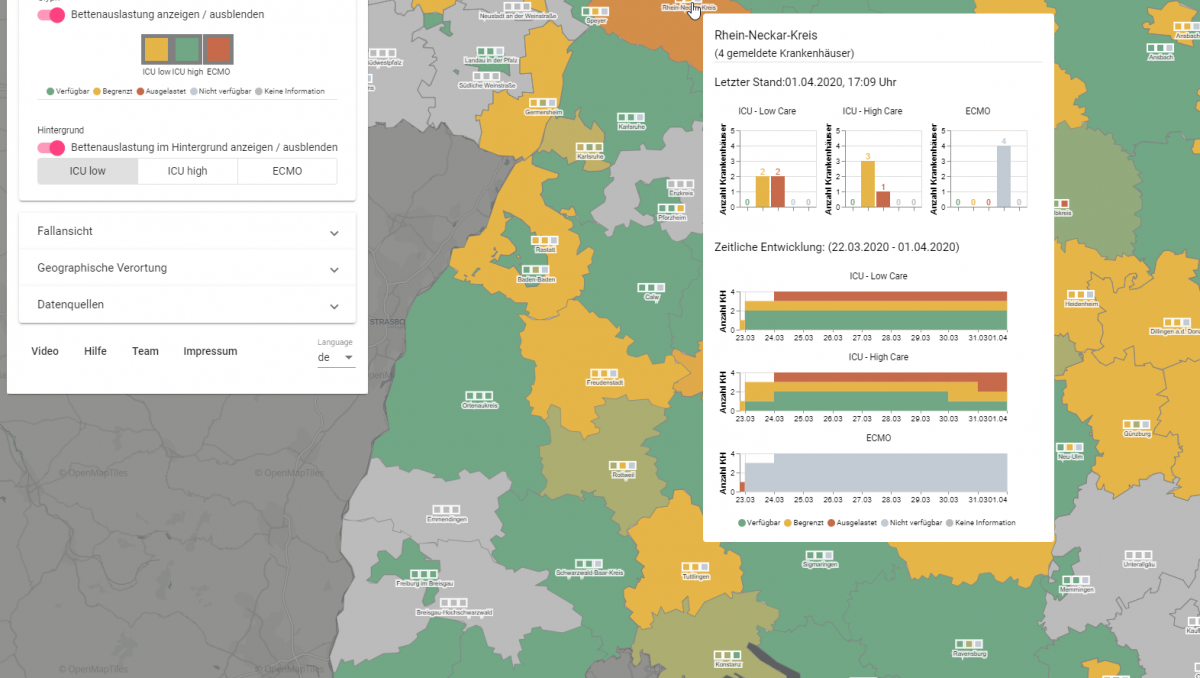
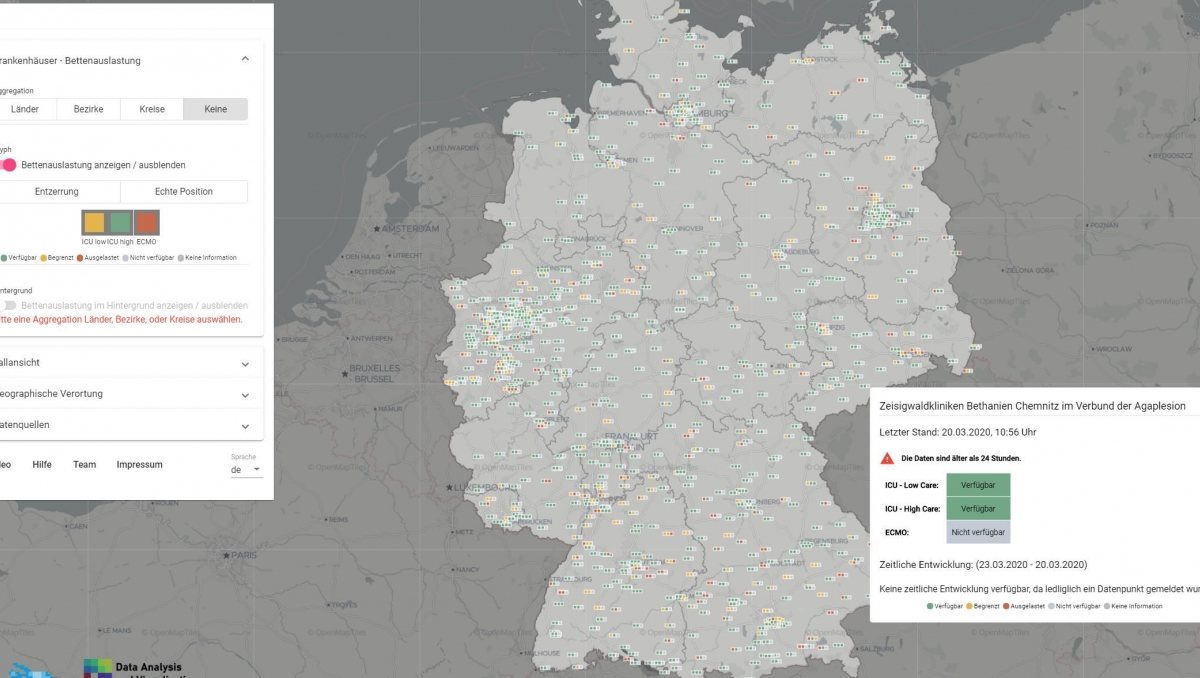
Similar to the DIVI intensive care register, “Coronavis” differentiates between three critical care bed categories: “Low care” for basic intensive care without invasive ventilation, “high care” for extended intensive care (with ventilation) and “ECMO” for beds with life support through extracorporeal membrane oxygenation, a process providing the patients with oxygen via their blood.
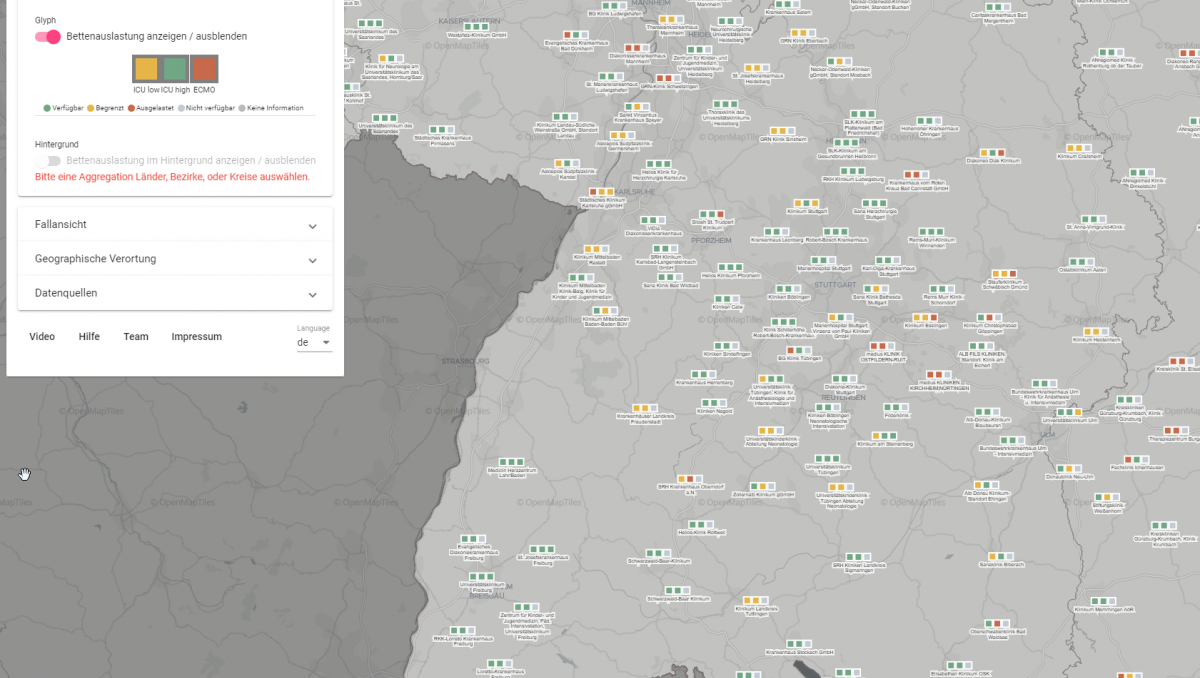
In cases of emergency, doctors must decide very fast whether it is necessary to transfer or distribute patients elsewhere. Additional information, such as helicopter landing pads or direct contact with the respective hospital, which can be displayed with the analysis tool from the University of Konstanz, might also be helpful in such cases.
© Non-overlapping display of the hospitals | Image: AG Datenanalyse und Visualisierung/University of KonstanzThe “Coronavis” tool developed at the University of Konstanz is available here: coronavis.dbvis.de
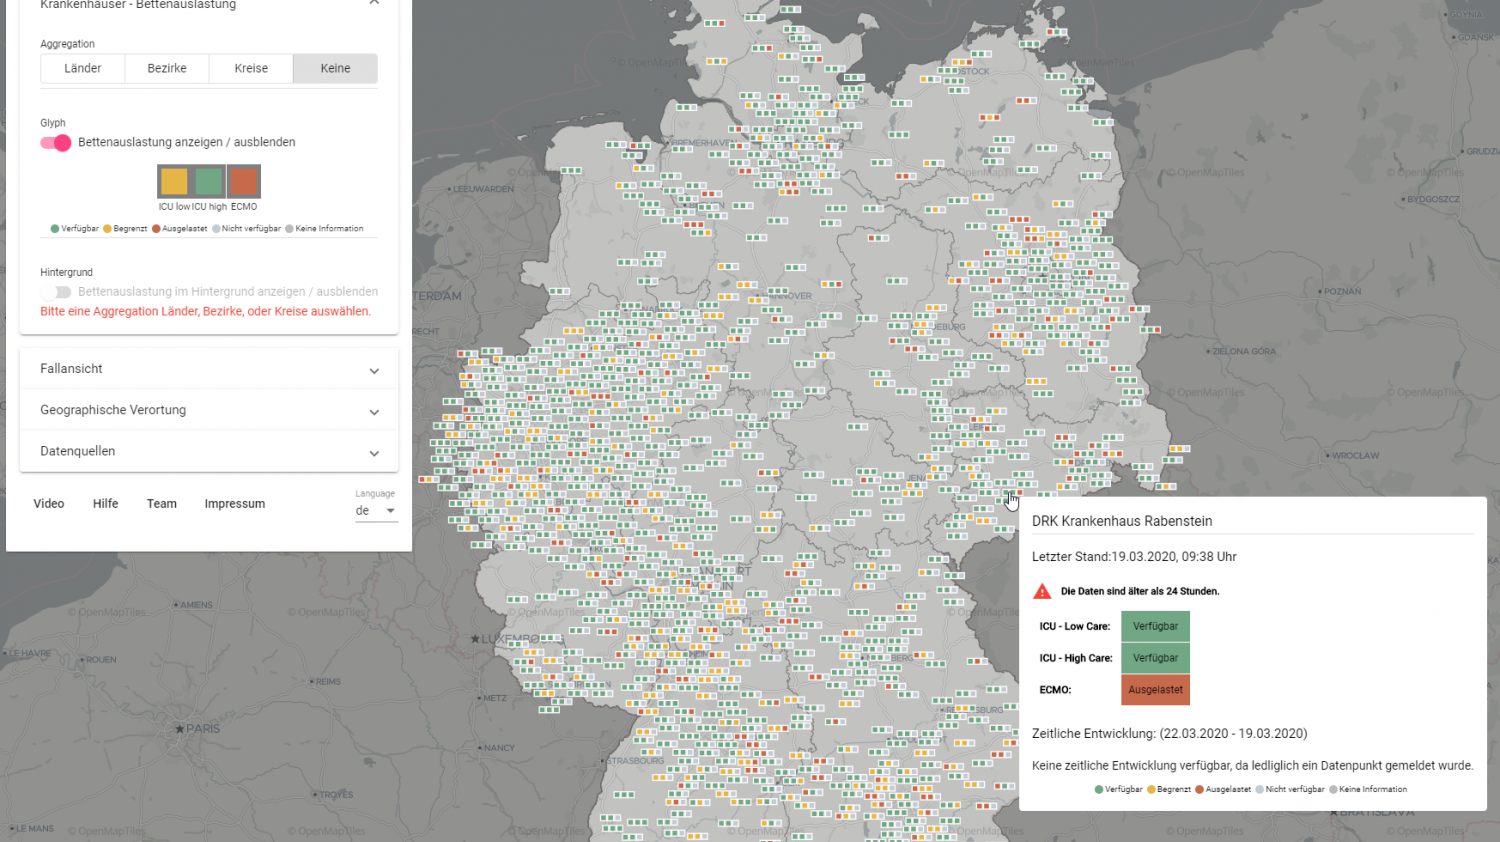
Selecting the view of states, regions or districts
In order to reduce complexity and be able to compare regions, the tool also allows users to view certain federal states, regions or districts.
The visualization tool from the University of Konstanz is ready for use and could also immediately show the number of occupied and available intensive care capacities if it had unlimited access to the DIVI intensive care register. Adaptations could successively be made after consultation with experts such as intensive-care doctors and epidemiologists. The programme could easily be adapted to other countries and could thus provide the basis for international collaboration to help tackle the corona crisis.


 Unchanged display of the hospitals
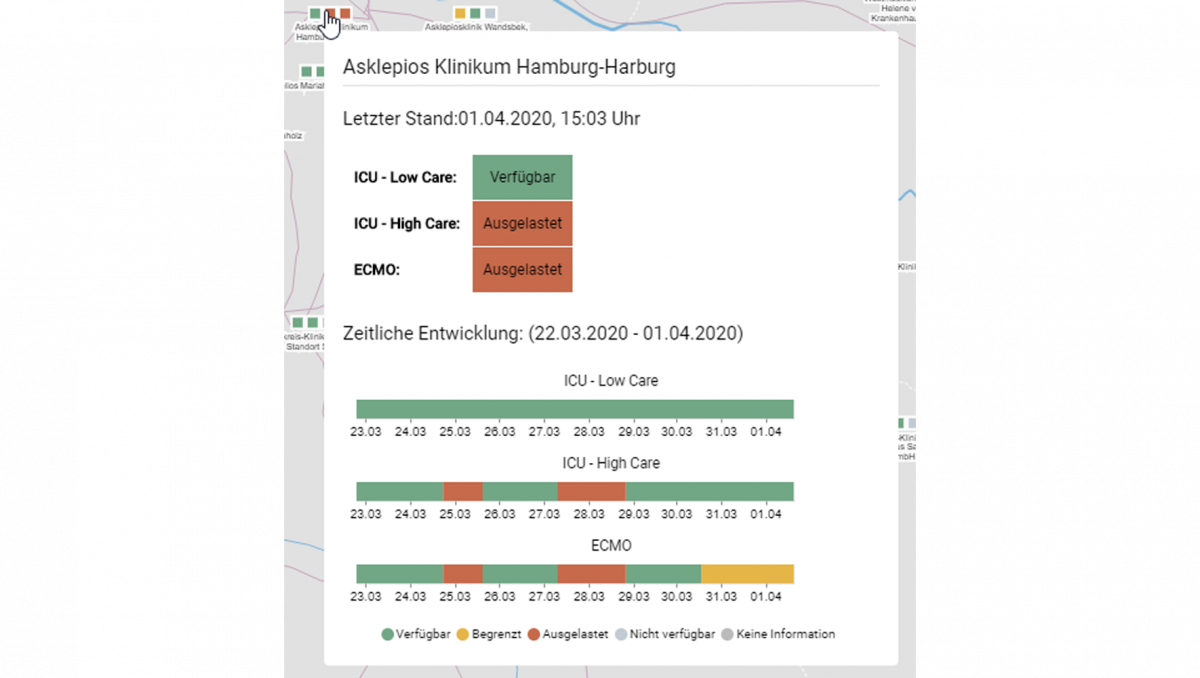
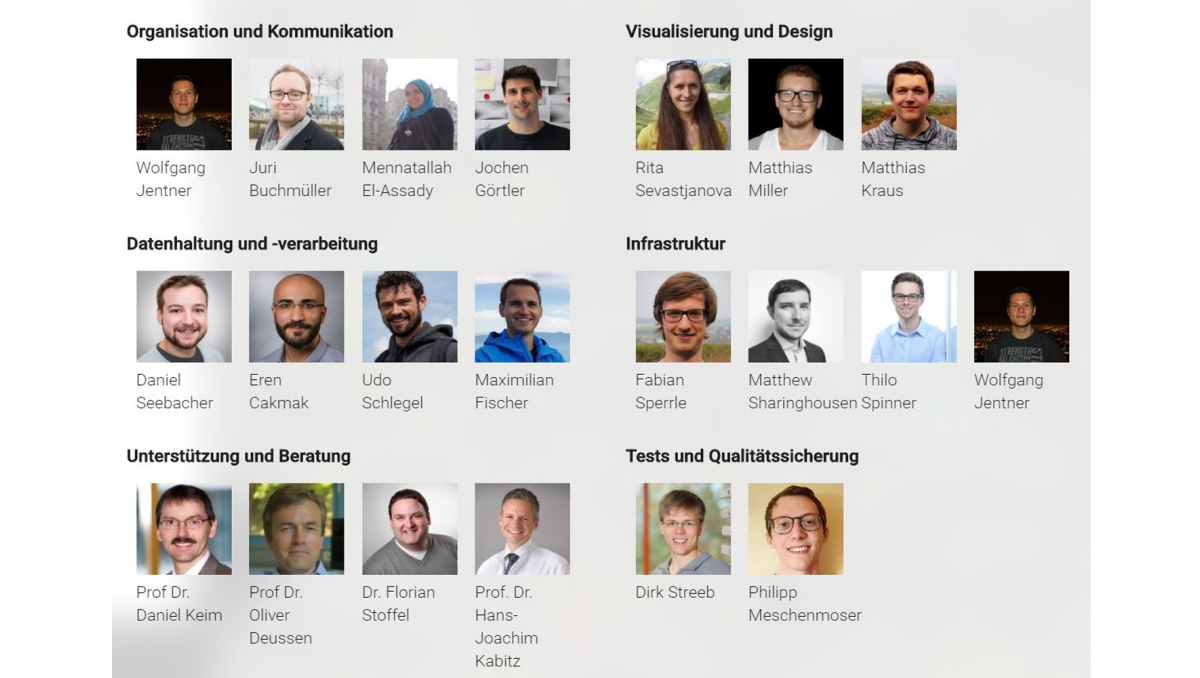 The team of the research group Data analysis and visualization at the University of Konstanz